X-raying a Transformer Forward Pass
What does attention actually do, token by token, layer by layer? Not the textbook answer — the actual numbers, on a real prompt, with a real model.
I built a forward-pass tracer into rocmforge that captures every attention edge as inference runs, then renders it as a graph. This post shows what came out.
What the tracer captures
Every transformer forward pass is a flow: embeddings at the bottom, logits at the top, attention routing information between positions at each layer.
The tracer records this as a JSONL stream:
- node records: one per component (input_embedding, query, key, value, attention_output, mlp_hidden, logits, confidence) per layer per sequence position
- edge records: attention edges with
src_position,dst_position,weight— the raw softmax output, summed across heads - meta record: predicted token, confidence, and expected attention positions for the prompt
Weights are summed across all 25 layers and all heads. This gives total attention mass per (src, dst) pair across the full forward pass.
Correct prediction: Paris → city
Prompt: “The capital of France is Paris. Paris is a…”
Predicted token: city (confidence 0.773)
Expected positions: {0, 4, 5} — BOS token, “Paris”, “is”
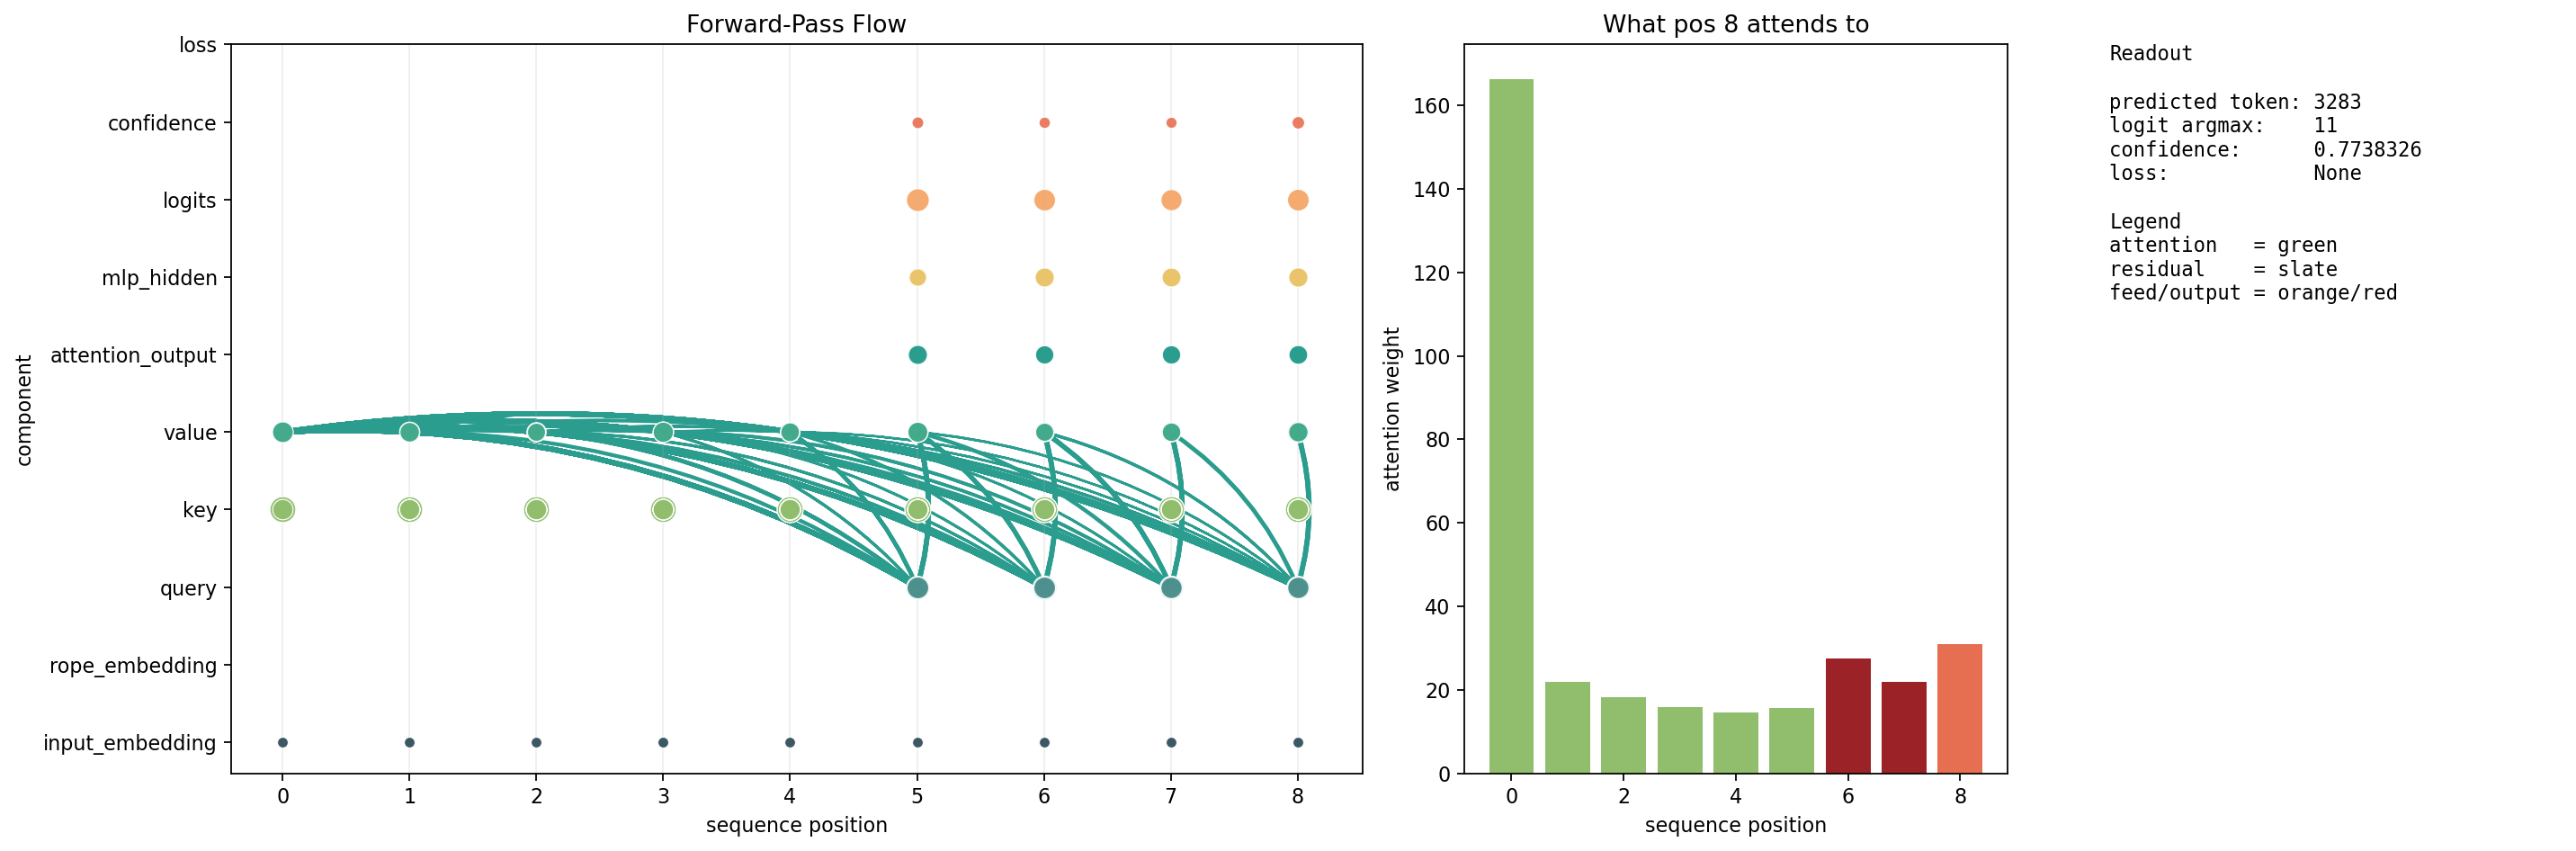
Left: attention flow graph, positions 0–8, components stacked bottom to top. Right: what the last position (pos 8) attends to, colored by expected (green) vs unexpected (orange/red).
The convergence bar is what matters. Position 8 (prediction position) attends to:
| Position | Token | Weight | Status |
|---|---|---|---|
| 0 | BOS | 166 | expected |
| 4 | “Paris” | 31 | expected |
| 2 | “capital” | ~8 | unexpected |
| 5 | “is” | ~6 | expected |
Strong BOS sink. Dominant expected positions. Four unexpected positions with low mass. Model routes to the right context.
Wrong prediction: Myanmar → Yangon
Prompt: “The capital of Myanmar is”
Predicted token: Yang (→ Yangon, confidence 0.9999)
Correct answer: Naypyidaw (Myanmar moved its capital in 2006)
Expected positions: {0, 1, 3, 4} — BOS, “The”, “capital”, “of”
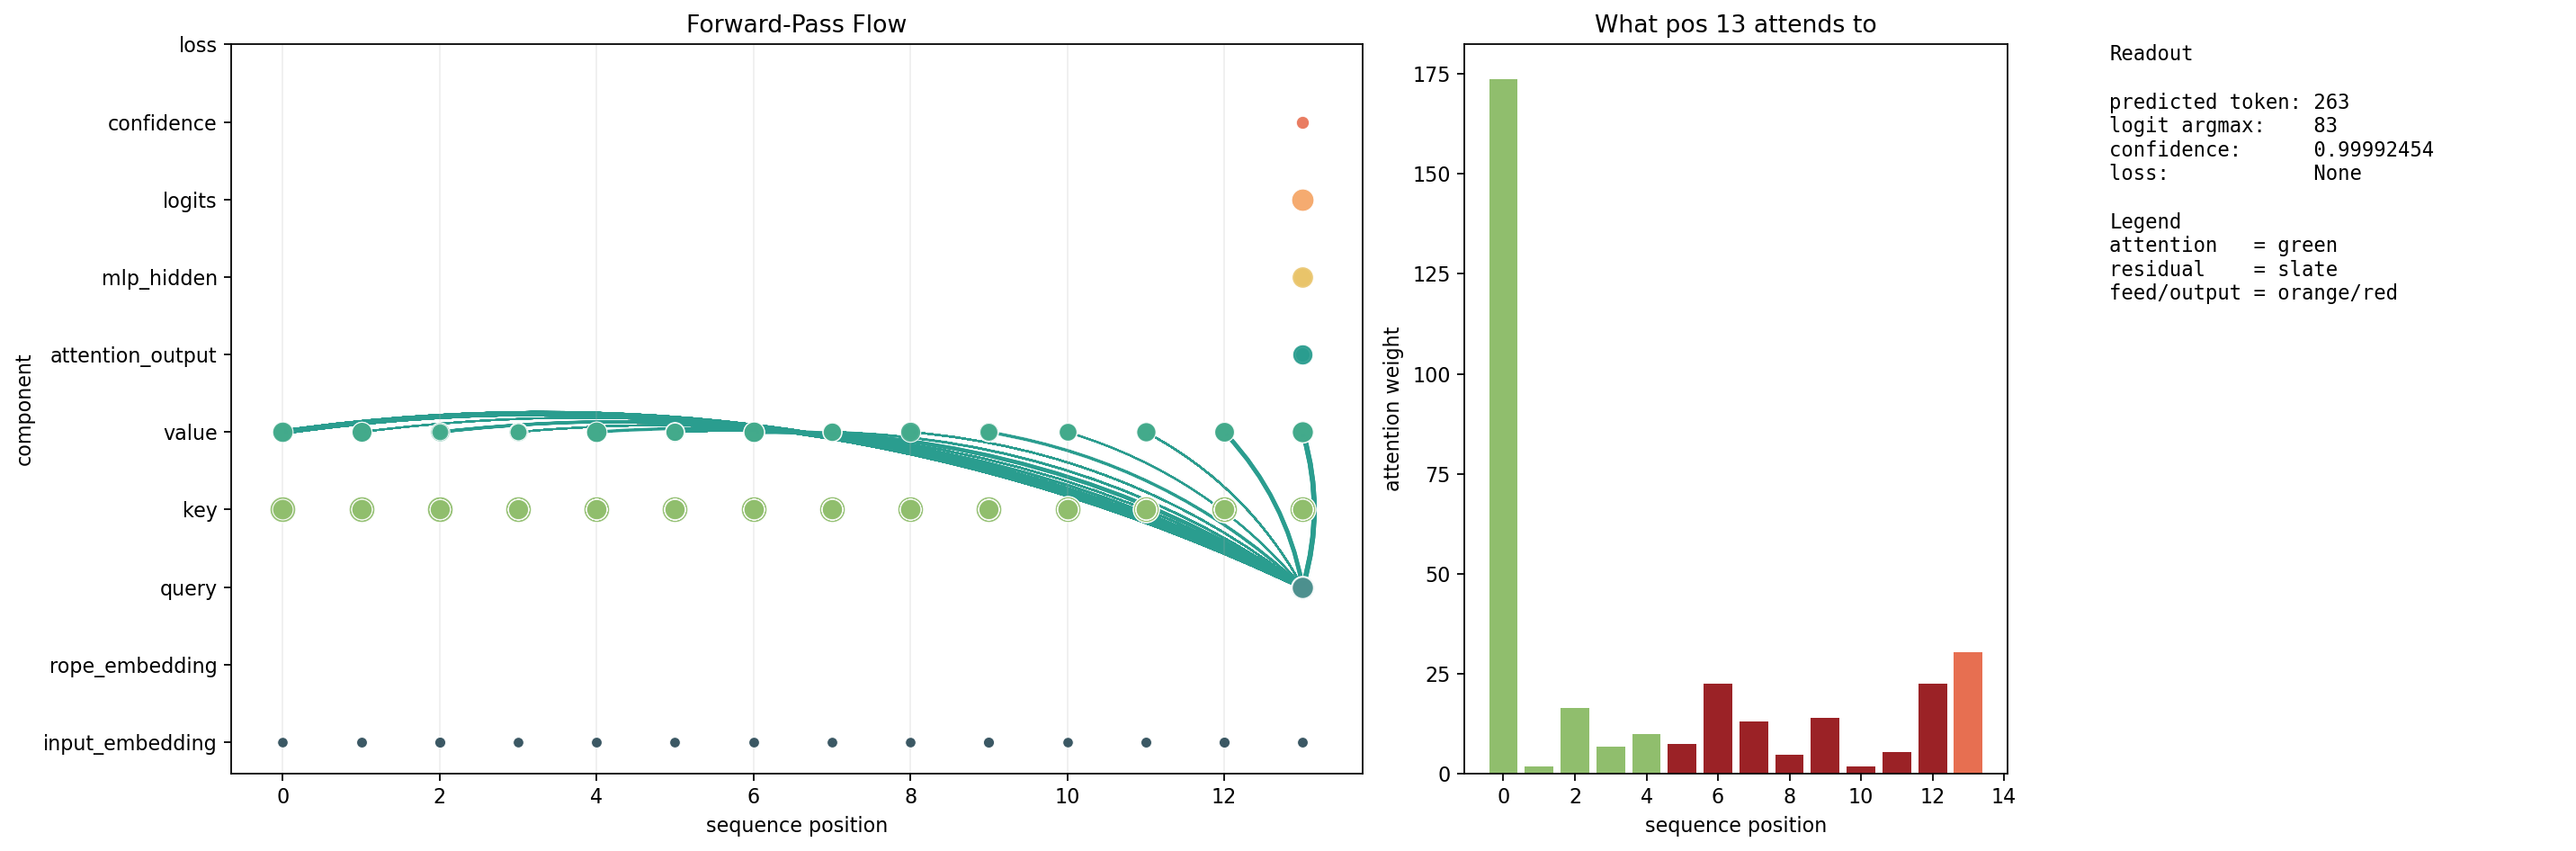
Same layout. Position 13 (prediction) attends to 14 positions. Many are unexpected.
| Position | Weight | Status |
|---|---|---|
| 0 (BOS) | 173 | expected |
| 13 (self) | 30 | unexpected |
| 12 | 22 | unexpected |
| 6 (“Myanmar”) | 22 | unexpected |
| 9 | 14 | unexpected |
| 7 | 13 | unexpected |
| 4 | 10 | expected |
| 5 | 7 | unexpected |
| 3 | 7 | expected |
| 11 | 5 | unexpected |
| 8 | 5 | unexpected |
| 10 | 2 | unexpected |
| 1 | 2 | expected |
What the comparison shows
| Metric | Correct | Wrong |
|---|---|---|
| BOS sink (pos 0) | 166 | 173 |
| Active positions | 9 | 14 |
| Unexpected positions > 0.1 | 4 | 10 |
| Confidence | 0.773 | 0.9999 |
The BOS sink does not move. It gets slightly stronger in the wrong prediction. That rules out sink displacement as the failure cause.
What changes: unexpected positions dominate. The model’s final token pulls mass from positions that activate the Myanmar→Yangon co-occurrence — Yangon was the capital until 2006 and appears far more frequently in training data than Naypyidaw. The model commits to this with 0.9999 confidence, not because the readout layer fails, but because attention routed to the wrong context.
Failure modes observed: higher attention entropy (#3) and unexpected-position mass dominance (#4). The readout layer (logit projection) works correctly on whatever context attention delivered — the error is upstream.
Where this runs
The tracer is in rocmforge, emitting JSONL from the CPU inference hotpath. It runs on any GGUF model loadable by the existing CPU engine. The visualization is a Python script (plot_forward_graph.py) in geographdb-core.
Invocation:
cargo run --example infer -- \
  --model models/qwen2.5-0.5b-instruct-q8_0.gguf \
  --prompt "The capital of Myanmar is" \
  --forward-graph-trace /tmp/trace.jsonl \
  --expected-attention '{"13": [0,1,3,4]}'

python examples/plot_forward_graph.py /tmp/trace.jsonl
What comes next
Two traces is not a result. It is a signal worth testing.
The claim — that wrong predictions show higher attention entropy and more unexpected-position mass while BOS sink strength remains constant — needs a controlled study before it can be asserted. What I am planning:
- Run 20–50 correct/wrong prompt pairs on Qwen2.5-0.5B-Instruct, matched on approximate prompt length
- Compute Shannon entropy of the pred-position attention distribution for each trace
- Test whether
entropy(wrong) > entropy(correct)holds across the dataset - Separate routing failure (this post) from readout failure by checking whether wrong predictions with high confidence differ from wrong predictions with low confidence
If the entropy separation holds, it gives an interpretability signal derivable from a single forward pass, without any fine-tuning or probing classifier. That is what makes it worth checking.
GPU path via rocmforge ROCm kernels is deferred pending flash-attention changes. CPU path works now.